Profit Improvement Report
Prepared for SWA
Vol. 28, No. 3
September 2019
Same Sales Volume, Different Profit
By Dr. Albert D. Bates
Principal, Distribution Performance Project
“Nothing happens until somebody sells something” is one of the oldest adages in business. It is also, undoubtedly, still one of the best.
However, exactly how those sales are generated is often overlooked. In fact, different ways of producing the exact same sales volume can lead to very different levels of profit. Most often the differences are substantial.
This report examines the financial impact of two different methods for increasing sales. The first is to sell more physical merchandise. The second is to raise the prices on the merchandise already being sold. The report will address these approaches from two important perspectives:
• The Profit Impact of Different Sales Strategies—An analysis of how different sales methods work through the firm’s income statement.
• Actions to Ensure Sales are Profitable—Specific suggestions as to how firms can drive higher profit on every sale.
The Profit Impact of Different Sales Strategies
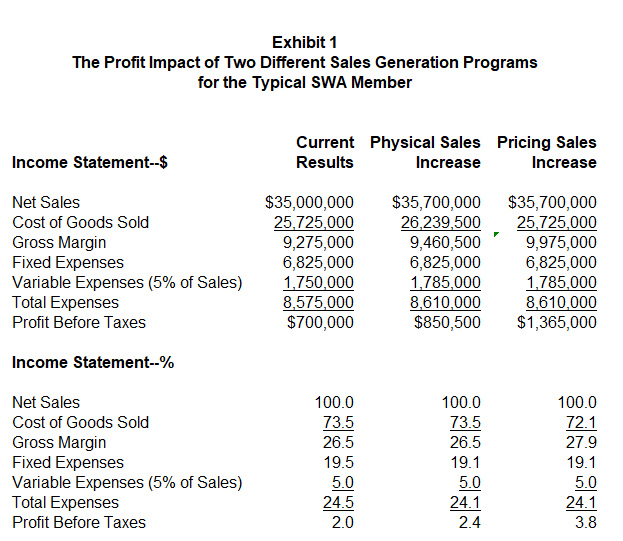
Exhibit 1 provides an income statement for the typical SWA member based upon the latest ABR Report. Typical means that half of the firms within SWA perform better than what is shown while half perform worse.
As can be seen in the first column, the firm currently generates $35.0 million in sales and operates on a gross margin of 34.0% of sales and expenses of 24.5%. This results in a pre-tax profit of $600,000, which is equal to 4.0% of sales.
To understand how different sales-generation strategies impact profit for this firm, it is necessary to break the expenses into two categories—fixed and variable. For too many firms this distinction is not clearly understood.
Fixed expenses are “overhead expenses.” The key factor is that once a budget is set for the year, these expenses will only change if management takes specific actions to change them, such as negotiating a lower rent. For most firms, fixed expenses represent somewhere around 80% of total expenses. For the typical SWA firm they are estimated to be $6,825,000 per year.
Variable expenses, in contrast, rise and fall automatically as sales rise and fall. They include sales commissions, interest on accounts receivable, and the like. For the typical firm variable expenses are estimated to be 5.0% of sales.
The second column of numbers—Physical Sales Increase—examines the impact of selling 2.0% more merchandise. As can be seen, sales, cost of goods sold, gross margin and variable expenses all increase by 2.0%. Fixed expenses remain constant. The final impact is that profit increases from $700,000 to $850,500, an increase of 21.5%.
While the 21.5% figure is impressive, it pales in comparison to the impact of a price increase that would generate the same level of sales volume. This is demonstrated in the last column of number—Pricing Sales Increase.
As can be seen there, sales increase by 2.0%, but cost of goods remain the same. This causes gross margin dollars to increase by 7.5% rather than the 2.0% gain from more physical sales activity. While this difference may seem small, it has major implications for profit.
In the last column the expense changes are identical to the middle column, with variable expenses rising with sales and fixed remaining constant. This means that the vast majority of the increase in gross margin will fall through to the bottom line. The result is that profit before taxes increases to $1,365,000, a remarkable gain of 95.0%.
Simply put, both of the changes result in the same level of dollar sales. However, one produces a nice increase in profits of 21.5%, while the other a celebratory increase of 95.0%. How sales growth is generated is a key determinant of profit.

Actions to Ensure Sales are Profitable
The predictable response to the third column of numbers is that it can’t be done. This is also a very legitimate response. In a competitive market, piling on even small price increases across the board is nearly impossible. Something else needs to happen. This requires three different actions.
Working With the Sales Force—Probably the single biggest barrier to enhancing the gross margin is the tendency of ineffective salespeople to cave in when confronted with price objections. Part of this has to do with the fact that customers are continually pushing for lower-price opportunities. Eventually these continual inquiries result in a logical conclusion. Salespeople begin to believe that prices really are too high.
At the same time, research shows that customers are actually less price sensitive than salespeople. Buyers are simply doing what they should do which is to see if lower prices are available. They are not necessarily convinced that there are lower prices, they are simply investigating.
Unfortunately, the bottom twenty percent of the sales force tends to give way on price with little resistance. Continual training is required to help these individuals overcome price objections. Ultimately, if training does not have an impact, firms must bear the cost of replacing them. The cost of finding and hiring new people is a one-time item. Lost margin and resulting lost profit is forever.
Strategic Pricing—For years, firms have been urged by the author and others to raise prices on the slowest-selling, and probably least price-sensitive, items in the assortment. Alas, for years firms have responded with little more than token efforts that have had little impact. This is not really a criticism. Instead, it is a reflection of the effort required to make the changes.
The underlying problem is that there are lots of SKUs in the slow-selling category. For most firms it is half the product line. As a result it is viewed as way too much work for too little improvement. Firms that have taken the effort, though, have been rewarded with a significant increase in their overall gross margin percentage without the loss of any physical sales volume.
Linking Prices to Services—Probably the largest computational challenge in pricing is linking prices charged to customers to the cost of servicing those customers. Research shows that some customers have an exceptionally high cost of service. This typically occurs because customers place lots of small orders, have a lot of emergency orders and overload the returns process. This is easy to comprehend, but the cost is difficult to calculate.
Given that the cost to serve is hard to determine, it is easier to simply avoid the entire issue. Again, though, research indicates that the differences in cost to service are seldom accounted for in pricing. With current technology, computing the cost to serve is becomingly progressively easier. The resulting analysis suggests that either services have to be lowered, or prices must be increased.
Moving Forward
Pricing remains the most important driver of profitability for distribution companies. It is essential to focus the firm on not just increasing sales, but doing so in a way that increases profit at the same time.
About the Author:
Dr. Albert D. Bates is Principal of the Distribution Performance Project and a Senior Advisor to Benchmarking Analytics. His latest book, Breaking Down the Profit Barriers in Distribution, is available online at Amazon and Barnes & Noble. It covers concepts that every decision maker should understand.
©2019 Distribution Performance Project and Benchmarking Analytics. SWA has unlimited duplication rights for this manuscript. Further, members may duplicate this report for their internal use in any way desired. Duplication by any other organization in any manner is strictly prohibited.
